To investigate how a bridge progresses from slight deformation to severe damage, engineers often amplify earthquake records incrementally and test it repeatedly in a computer. This incremental dynamic analysis is widely used. For structures near faults, the study asks a further question: can increasing earthquake magnitude provide stronger inputs with corresponding physical source processes?
Scaling a record versus generating a larger earthquake
Multiplying an entire record by a factor changes its amplitude while preserving many waveform features. A real change in earthquake magnitude also involves rupture, duration and frequency content. Near-fault motion is additionally sensitive to rupture direction and source distance.
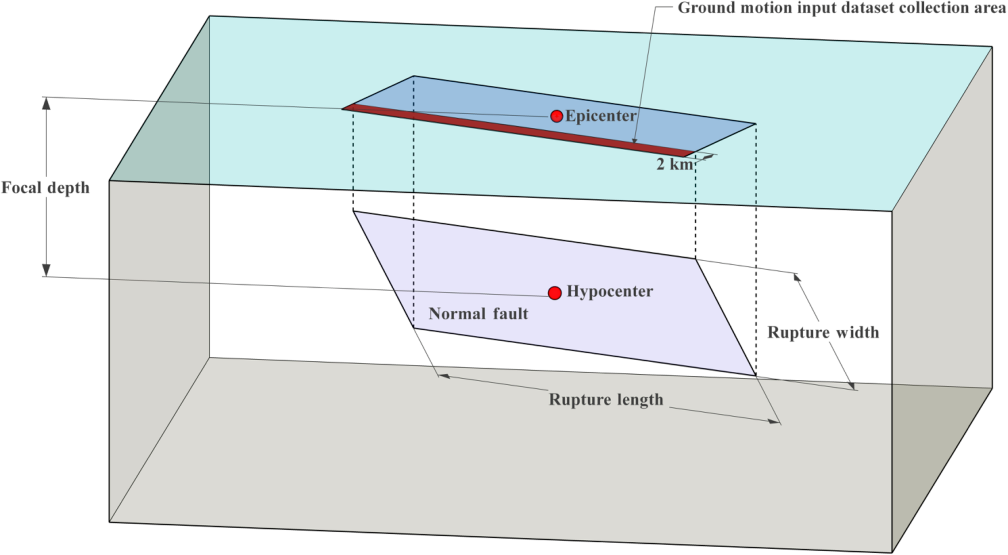
The paper proposes magnitude-based incremental dynamic analysis, MIDA. Physics-based simulations generate inputs at different magnitudes, which are then applied to a near-fault structure. The fault and bridge geometry in the figure places the earthquake source and engineering location within the same scenario.
Traditional IDA resembles turning up the volume of the same sound. MIDA starts with changes to the source and generates the corresponding input again. The approaches address similar questions but organize scenarios differently. For a near-fault bridge, the relative source–bridge position influences how waves reach each support. Physical simulation incorporates these relationships in a consistent setting, giving increasingly strong inputs explicit source conditions tied to the structural site.
Test the bridge with scenarios that have a physical origin
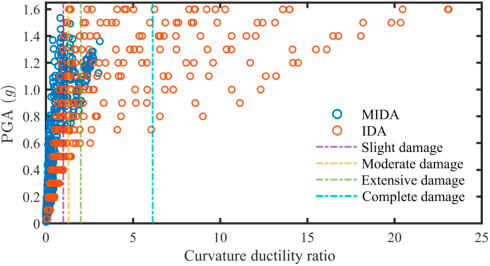
For a near-fault cable-stayed bridge, the study follows curvature ductility demand at the tower base. Curvature describes bending, while ductility demand characterizes deformation after the member becomes nonlinear. As earthquake scenarios intensify, the response progresses into stronger nonlinear behaviour.
The paper compares MIDA with conventional IDA. In the strong-motion scenarios studied, MIDA yields less dispersed responses: the coefficient of variation decreases from 95.3% for the conventional method to 51.5% in the corresponding example. The scatter plots make the difference visible and show how input-generation methods influence response statistics.
Curvature ductility describes how much further a member must bend after reaching yield. Following tower-base response as intensity increases traces the transition from small deformation to stronger nonlinearity. Scatter reflects variation between input scenarios, while the coefficient of variation relates fluctuation to the mean. The comparison therefore includes both response growth with intensity and the spread of results under similar intensity conditions.
Connect limit-state analysis to source conditions
Conventional incremental analysis provides a convenient performance-tracking tool. The magnitude-based route additionally uses source and propagation models to organize physically related scenarios. For near-fault structures, this helps explain which earthquake conditions produce a particular set of large responses.
The study extends progressively stronger shaking from a simple amplitude operation to changes in source-based scenarios. Bridge performance assessment can consequently connect regional seismic conditions more closely with the deformation demands of a specific structure.
Ultimately, assessment asks which scenarios are likely to push critical members beyond a deformation threshold. Relating them to magnitude, source and site settings explains the physical origin of high responses and supports comparisons between locations or structural schemes. MIDA moves input generation upstream toward the source, linking scenario construction with nonlinear structural analysis and providing another way to organize near-fault performance assessment.