Installing isolation bearings adds a horizontally deformable buffer between the ground and a building. Engineers also want to know how likely the building is to enter different damage states as shaking intensifies. Answering this expands a single calculation into a map of risk against earthquake intensity.
The building and its bearings have different jobs
The superstructure should remain as intact as possible, while the bearings undergo larger horizontal deformation to reduce forces transmitted upward. The study therefore follows two indicators: relative deformation between storeys and the distance the isolation bearings must move.
Material properties, bearing parameters and ground motions all vary. Combining every possibility in detailed analyses would be time-consuming. The paper uses response surfaces: representative calculations first establish approximate relationships between inputs and structural responses, and these relationships then support probabilistic analysis.
Fragility answers a conditional probability question: at a given ground-motion intensity, what is the probability of exceeding a specified performance limit? Many combinations of material properties and earthquake records produce a curve against intensity. The frame and isolation layer are treated separately because their demands differ. Larger frame drifts affect beams, columns and connections, while larger bearing displacements concern device movement capacity and available clearance.
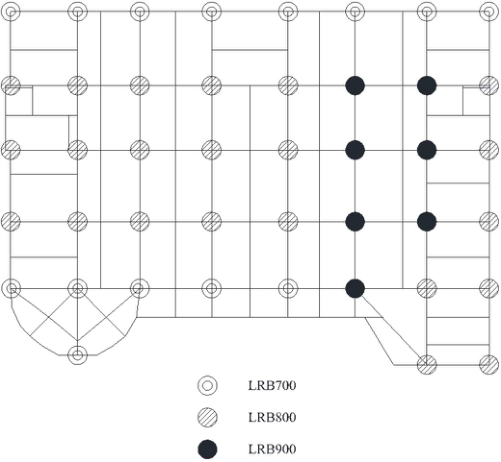
A lightweight substitute for expensive calculations
A response surface resembles a quick-reference map calibrated from samples: given structural and earthquake parameters, it rapidly estimates the response of interest. Comparisons with Monte Carlo analysis assess its accuracy and efficiency. The study also considers the system formed by the isolation layer and superstructure together.
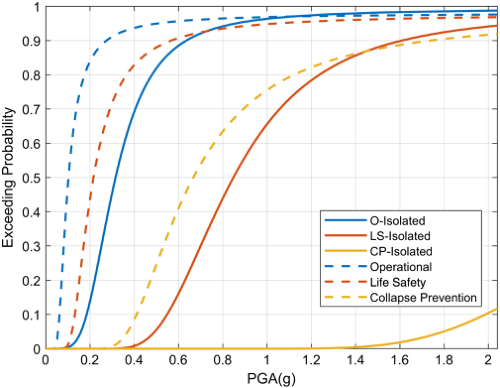
The resulting fragility curves plot earthquake intensity horizontally and the probability of exceeding a damage or performance threshold vertically. For the same state and intensity, a lower curve means a smaller probability of entering that state. The original figure compares isolated and non-isolated structures to show how isolation changes risk.
Building a response surface starts by identifying influential parameters and selecting samples within reasonable ranges. Detailed models supply sample responses, while the approximate relationship fills in the variations between them. Computational effort is concentrated on calibration and validation, leaving many random combinations to the fast model. The paper considers both average response and dispersion so the curves reflect typical behaviour and variability across inputs and parameter combinations.
Turn reduced shaking into comparable risk
In the example, isolation substantially reduces the probability of superstructure damage. As earthquakes become stronger, bearing displacement demand becomes an important part of system assessment. This reflects the division of labour: less deformation upstairs, more movement in the devices below.
The method lets designers compare parameter combinations and performance objectives without rerunning a complete nonlinear analysis for every random sample. A set of probability curves describes isolation effectiveness and provides a more direct basis for selecting schemes and evaluating risk.
Considering the frame and isolation layer together has a further system-level meaning: even if the superstructure performs well, the isolation devices must still meet their demands. The study builds system assessment from the performance relationships of both parts. Along one analysis path, designers can observe how changes in bearing parameters affect superstructure damage probability and base displacement demand, then seek a configuration meeting their objectives.